
PythonЃКDjangoПђМмПЊЗЂЪ§ОнПЩЪгЛЏЭјеО
2018-06-23 13:32:43РДдДЃКЮДжЊ дФЖС ()

Step 0: ЪЙгУаТЕФ virtualenv ЛЗОГ
НЈвщЪЙгУ 1.11.4 АцБОЕФ Django
$ virtualenv --no-site-packages pyecharts-env
$ source pyecharts-env/bin/activate
$ pip install django==1.11.4
$ pip install pyecharts
Step 1: аТНЈвЛИі django ЯюФП
$ django-admin startproject myechartsite
ДДНЈвЛИігІгУГЬађ
$ python manage.py startapp myfirstvis
$ ls
db.sqlite3      manage.py       myechartsite    myfirstvis
дк myechartsite/settings.py жазЂВсгІгУГЬађ
# myechartsite/settings.py
INSTALLED_APPS = [
    'django.contrib.admin',
    'django.contrib.auth',
    'django.contrib.contenttypes',
    'django.contrib.sessions',
    'django.contrib.messages',
    'django.contrib.staticfiles',
    'myfirstvis'  # <---
]
ЮвУЧЯШБрМ urls.py.етЮФМўдк Django РяЕФЙІФмЪЧАбЧАЖЮЕФ HTTP ашЧѓКЭКѓЬЈЗўЮёКЏЪ§ЙвЙГЁЃдк Step3ЃЌЮвУЧдйв§ШыКѓЖЫЗўЮёКЏЪ§
1 # myfirstvis/urls.py
2 from django.conf.urls import url
3
4 from . import views
5
6 urlpatterns = [
7     url(r'^$', views.index, name='index'),
8 ]
дк myechartsite/urls.py жааТді 'myfirstvis.urls'
1 myechartsite/urls.py
2 from django.conf.urls import include, url
3 from django.contrib import admin
4
5 urlpatterns = [
6     url(r'^admin/', admin.site.urls),
7     url(r'myfirstvis/', include('myfirstvis.urls'))  # <---
8 ]
Step 2: ДІРэЪгЭМЙІФмВПЗж
НЋЯТСаДњТыБЃДцЕН myfirstvis/views.py жаЁЃ
 1 from __future__ import unicode_literals
 2 import math
 3
 4 from django.http import HttpResponse
 5 from django.template import loader
 6 from pyecharts import Line3D
 7
 8
 9 REMOTE_HOST = "https://pyecharts.github.io/assets/js"
10
11
12 def index(request):
13     template = loader.get_template('myfirstvis/pyecharts.html')
14     l3d = line3d()
15     context = dict(
16         myechart=l3d.render_embed(),
17         host=REMOTE_HOST,
18         script_list=l3d.get_js_dependencies()
19     )
20     return HttpResponse(template.render(context, request))
21
22
23 def line3d():
24     _data = []
25     for t in range(0, 25000):
26         _t = t / 1000
27         x = (1 + 0.25 * math.cos(75 * _t)) * math.cos(_t)
28         y = (1 + 0.25 * math.cos(75 * _t)) * math.sin(_t)
29         z = _t + 2.0 * math.sin(75 * _t)
30         _data.append([x, y, z])
31     range_color = [
32         '#313695', '#4575b4', '#74add1', '#abd9e9', '#e0f3f8', '#ffffbf',
33         '#fee090', '#fdae61', '#f46d43', '#d73027', '#a50026']
34     line3d = Line3D("3D line plot demo", width=1200, height=600)
35     line3d.add("", _data, is_visualmap=True,
36                visual_range_color=range_color, visual_range=[0, 30],
37                is_grid3D_rotate=True, grid3D_rotate_speed=180)
38     return line3d
cript_list ЪЧ Page() РрфжШОЭјвГЫљашвЊвРРЕЕФ echarts js ПтЃЌвРРЕЕФПтЕФЪ§СПШЁОігкЫљвЊфжШОЕФЭМаЮжжРрЁЃ
host ЪЧ echarts js ПтЕФЕижЗЃЌФЌШЯЬсЙЉЕФЕижЗЮЊ https://pyecharts.github.io/assets/js ЕБШЛЃЌШчЙћФудИвтФувВПЩвдИФБфетИіЕижЗЃЌЯШПЫТЁ https://github.com/pyecharts/assets ШЛКѓНЋ js ЮФМўМаЙвдидкФуздМКЕФЗўЮёЦїЩЯМДПЩЁЃ
Step 3: ЮЊЯюФПЬсЙЉздМКЕФФЃАх
Windows ЯЕЭГ
дк myfirstvis ФПТМЯТЃЌаТНЈ templates/myfirstvis згФПТМ
myfirstvis ФПТМ
ЉЄ myfirstvis ЉРЉЄЉЄ admin.py ЉРЉЄЉЄ apps.py ЉРЉЄЉЄ __init__.py ЉРЉЄЉЄ migrations ЉІ ЉРЉЄЉЄ __init__.py ЉРЉЄЉЄ models.py ЉРЉЄЉЄ templates ЉІ ЉИЉЄЉЄ myfirstvis ЉІ ЉИЉЄЉЄ pyecharts.html ЉРЉЄЉЄ tests.py ЉРЉЄЉЄ urls.py ЉИЉЄЉЄ views.py
НЋЯТУц html ФЃАхДњТыБЃДцЮЊ pyecharts.htmlЃЌЧыШЗБЃ pyecharts.html ЮФМўЕФОјЖдТЗОЖЮЊ <project root>/myfirstvis/templates/myfirstvis
 1 <!-- myfirstvis/templates/pyecharts.html -->
 2 <!DOCTYPE html>
 3 <html>
 4
 5 <head>
 6     <meta charset="utf-8">
 7     <title>Proudly presented by PycCharts</title>
 8     {% for jsfile_name in script_list %}
 9         <script src="{{ host }}/{{ jsfile_name }}.js"></script>
10     {% endfor %}
11 </head>
12
13 <body>
14   {{ myechart|safe }}
15 </body>
16
17 </html>
Step 4: дЫааЯюФП
$ cd myechartsite
$ python manage.py runserver

You have 13 unapplied migration(s). Your project may not work properly until you apply the migrations for app(s): admin, auth, contenttypes, sessions.
Run 'python manage.py migrate' to apply them.

August 08, 2017 - 05:48:38
Django version 1.11.4, using settings 'myechartsite.settings'
Starting development server at http://127.0.0.1:8000/
Quit the server with CONTROL-C.
ЗУЮЪ http://localhost:8000/myfirstvis/ЃЌФуОЭПЩвдПДЕНПсьХЕФ 3D ЭМСЫ

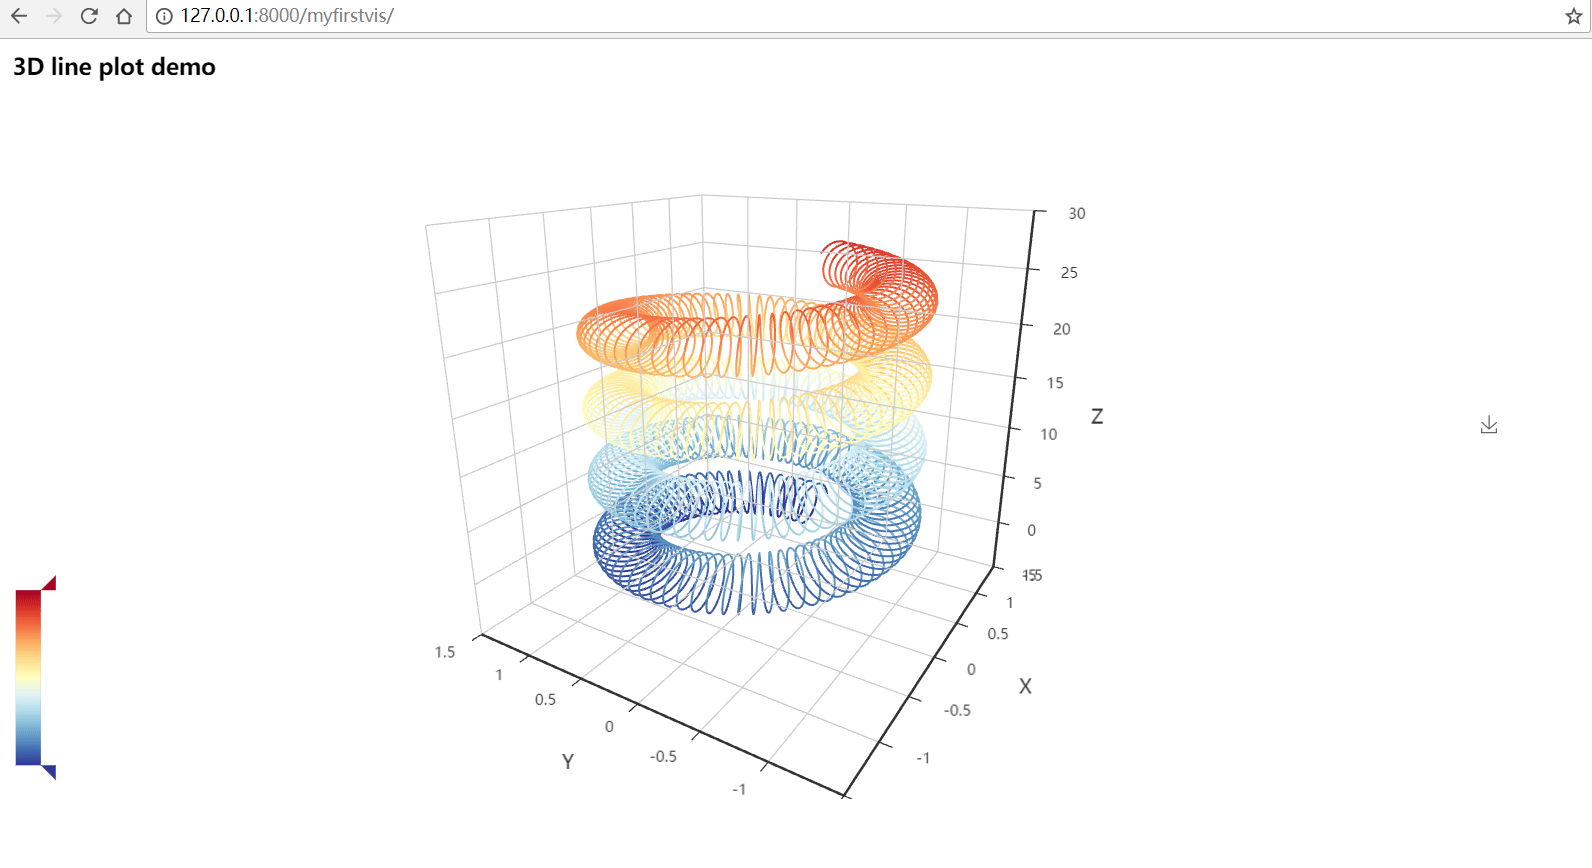
аЁНс
ПДЕНСЫАЩЃЌжЛашвЊМђЕЅЕФМИВНОЭПЩвдЪЙгУ pyecharts ДДНЈПЩЪгЛЏЕФЭМБэЁЃDjango ЙйЗННЬГЬашвЊЦпВНЕФетРяЮвУЧШ§ВНОЭИуЖЈСЫЁЃ
БъЧЉЃК
АцШЈЩъУїЃКБОеОЮФеТВПЗжздЭјТчЃЌШчгаЧжШЈЃЌЧыСЊЯЕЃКwest999com@outlook.com
ЬиБ№зЂвтЃКБОеОЫљгазЊдиЮФеТбдТлВЛДњБэБОеОЙлЕуЃЌБОеОЫљЬсЙЉЕФЩугАееЦЌЃЌВхЛЃЌЩшМЦзїЦЗЃЌШчашЪЙгУЃЌЧыгыдзїепСЊЯЕЃЌАцШЈЙщдзїепЫљга

ЩЯвЛЦЊЃКDjangoжЎ--ФЃАхМгдиЭМЦЌ
- python3ЛљДЁжЎЁАЪѕгяБэЃЈ2ЃЉЁБ 2019-08-13
- python3 жЎ зжЗћДЎБрТыаЁНсЃЈUnicodeЁЂutf-8ЁЂgbkЁЂgb2312ЕШ 2019-08-13
- Python3АВзАimpala 2019-08-13
- аЁАзШчКЮШыУХ Python ХРГцЃП 2019-08-13
- python_зжЗћДЎЗНЗЈ 2019-08-13
IDCзЪбЖЃК жїЛњзЪбЖ зЂВсзЪбЖ ЭаЙмзЪбЖ vpsзЪбЖ ЭјеОНЈЩш
ЭјеОдЫгЊЃК НЈеООбщ ВпЛЎгЏРћ ЫбЫїгХЛЏ ЭјеОЭЦЙу УтЗбзЪдД
ЭјеОСЊУЫЃК СЊУЫаТЮХ СЊУЫНщЩм СЊУЫЕуЦР ЭјзЌММЧЩ
аавЕзЪбЖЃК ЫбЫїв§Чц ЭјТчгЮЯЗ ЕчзгЩЬЮё ЙуИцДЋУН
ЭјТчБрГЬЃК Asp.NetБрГЬ AspБрГЬ PhpБрГЬ XmlБрГЬ Access Mssql Mysql ЦфЫќ
ЗўЮёЦїММЪѕЃК WebЗўЮёЦї FtpЗўЮёЦї MailЗўЮёЦї DnsЗўЮёЦї АВШЋЗРЛЄ
ШэМўММЧЩЃК ЦфЫќШэМў Word Excel Powerpoint Ghost Vista QQПеМф QQ FlashGet бИРз
ЭјвГжЦзїЃК FrontPages Dreamweaver Javascript css photoshop fireworks Flash
ГЬађЩшМЦЃК JavaММЪѕ C/C++ VB delphi

- PhotoshopЛцжЦСЂЬхЗчИёЕФЮЂаІБэЧщ
- PSЮФзжЬиаЇНЬГЬЃКжЦзїЙЋТЗЩЯИіадЕФЭПбЛ
- PhotoshopЩшМЦОэБпаЇЙћЕФБфаЮН№ИеЕчгА
- PSЩЋВЪаоИДНЬГЬЃКРћгУЩЋНзЙЄОпПьЫйИјКь
- PSАыЭИУїЮяЬхПйЭМЃКРћгУЭЈЕРбЁЧјЙЄОпПй
- PSКЃБЈЩшМЦММЧЩНЬГЬЃКбЇЯАжЦзїИіадЕФХЄ
- PSЭМЦЌЬиаЇжЦзїНЬГЬЃКбЇЯАИјЬњЫўЭМЦЌжЦ
- бЇЯАгУphotoshopАбЛызЧЕФКЃЫЎееЦЌКѓЦк
- PSЙХЗчееЦЌНЬГЬЃКИјЙХЗчУРХЎДђдьГіХЎЯР
- PSИіадШЫЮяКЃБЈжЦзїЃКЩшМЦДДвтЪБЩаЕФВЃ
- ЗжЯэ ЁЖРћгУPythonНјааЪ§ОнЗжЮі(ЕкЖўАц
- ЕквЛеТЃКе§дђБэДяЪН
- ЁЖPythonН№ШкДѓЪ§ОнЗжЮіЁЗжаЮФАцPDF+гЂ
- PythonгаФФаЉгаШЄЕФДњТыФиЃЌетаЉДњТыШУ
- PandasЪ§ОнШЅжиКЭЖджиИДЪ§ОнЗжРрЁЂЧѓКЭ
- kettleАВзАВПЪ№МАдЖГЬжДаа
- ПДШеБОЕчгАецЭДПрЃЌБОРДОЭЬ§ВЛЖЎЃЁЛЙУЛ
- ЛљгкpythonЕФжжзгЫбЫїЭјеОЃЌФуЖЎЕУЃЁ
- РћгУPythonЛЭМЃЌЧЇБфЭђЛЏЃЌИїжжЛЭМММ
- ЪвгбЭцЛиКЯжЦгЮЯЗЃЌдТШыСНЭђЃЁЮвгУPyth